Blog summary
Modern observability platforms are transforming how organizations handle application performance monitoring and troubleshooting.
Key takeaways:
- Critical Challenge: Application teams and IT infrastructure teams traditionally work in silos, leading to delayed problem resolution and increased MTTR.
- Key Innovation: Automated correlation between advanced synthetic monitoring and infrastructure telemetry enables immediate root cause identification.
- Business Impact: Organizations can reduce troubleshooting time from hours to minutes while improving collaboration between internal application and IT infrastructure teams.
- Competitive Edge: While synthetic monitoring has become standard, advanced synthetic monitoring with automated correlation capabilities represents the next evolution in observability.
- Future Direction: Intelligent observability platforms that leverage AI for automated correlation are becoming essential for managing complex, cloud-native environments.
The Challenge: A Tale of Two Teams
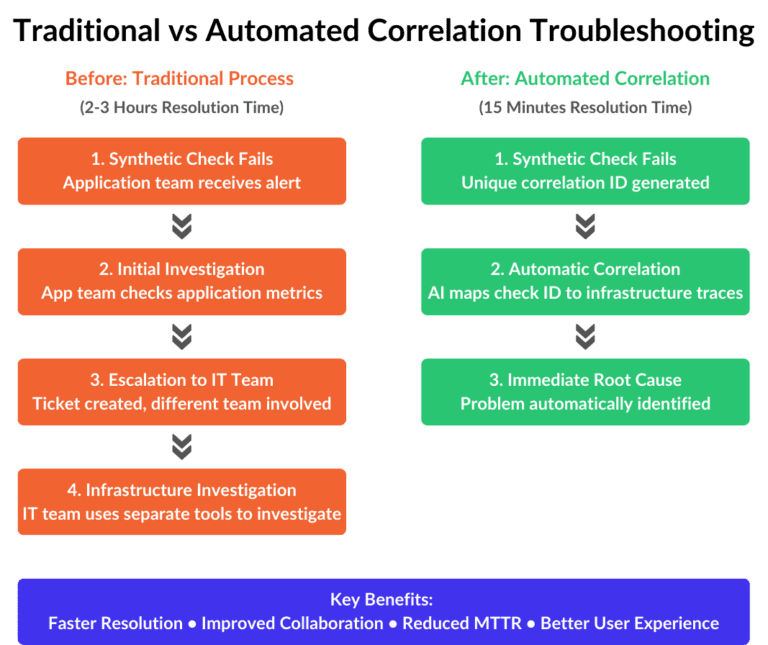
Picture this scenario: An application team receives an alert that a critical business workflow has failed. The monitoring check shows that end-users are experiencing issues, but the application itself appears to be running normally. This is where the traditional process breaks down:
- The application team sees the problem but can’t identify the root cause.
- They are forced to escalate to the IT infrastructure team.
- Different tools, different perspectives, and different reporting structures create friction.
- Time is wasted in back-and-forth communications.
- Mean Time to Resolution (MTTR) suffers as a result.
As one senior IT architect recently noted: “Most often the folks monitoring these issues are the application team. They see an end-user experience problem, the core application is not working, and the business workflow is failing – but they don’t know why. It’s not the application, but there’s something on the backend that we can’t see or correlate directly, so we have to throw it over the wall to our friends on the IT side.”
Beyond Basic Synthetic Monitoring to Advanced Synthetic Monitoring

While synthetic monitoring has become table stakes in the observability space, with many vendors offering similar capabilities, the real differentiation lies in what happens after an issue is detected. Basic synthetic monitoring tells you that something is wrong, but not why it’s wrong.
Key applications must perform well to maintain end-user productivity and avoid negative impacts. Apica is the only platform that correlates synthetic monitoring workflow “check” failures directly to an IT infrastructure problem. With its unique, unified platform with advanced synthetic monitoring, Apica can correlate directly between distributed tracing and synthetic monitoring. This is built into Apica DNA – correlating these kinds of events and applying advanced synthetic monitoring to these complex workflows.
The Technical Deep Dive: How Advanced Synthetic Monitoring and Modern IT Event Correlation Works
This platform evolution integrates intelligent observability with advanced synthetic monitoring to monitor distributed traces and related synthetic application workflows. The platform captures the actual ID associated with a failing synthetic “check” (representing an application impact to an end-user), and then uses the ID to correlate to the related trace within the IT infrastructure telemetry that may be causal to the problem. In a nutshell, once a failure occurs, the correlation ID can trace the environment, IP address, server, host name, or the network to identify the core issue. Here’s a detailed look at the technical process:
1. Advanced Synthetic Check Execution:
- Complex business journeys are monitored through synthetic checks
- These checks traverse multiple components including:
o Multi-factor authentication checkpoints
o Multi-cloud environments
o Hybrid infrastructure (on-premises and/or cloud)
o Complex workflow steps
2. Unique Identifier Generation:
• Each synthetic check generates a unique correlation ID
• This ID is tracked across the entire transaction path
• The ID serves as a thread connecting user experience to infrastructure performance
3. Distributed Tracing Integration:
- The correlation ID is mapped to distributed traces
- Traces capture the complete journey of requests across:
o Microservices
o APIs
o Infrastructure components
o Network paths
4. AI-Powered Event Correlation:
- Machine learning algorithms analyze patterns between:
o Failing synthetic checks
o Infrastructure telemetry
o System logs
o Performance metrics
- Automatic identification of related events and potential root causes
5. Unified Alert Generation:
• When a check fails, the system:
o Identifies the specific intelligent observability platform ID
o Uses it as a correlation ID to any related traces
o Maps to specific environment components
o Pinpoints exact infrastructure elements (IP address, server, host, or network)
As one platform architect explains: “With Apica, we’re finding that needle in a haystack, but in a completely automated way. When you have a failing check and understand you can correlate to a distributed trace, you can immediately map the problem to specific infrastructure components.”
Real-World Impact
Consider this actual customer scenario:
“We had a critical e-commerce workflow failing intermittently. Traditionally, it would take our teams 2-3 hours to identify the root cause, with multiple handoffs between application and IT infrastructure teams. With Apica and advanced synthetic monitoring with automated correlation, we identified a network latency issue in our cloud infrastructure within minutes. What used to be a multi-hour blame game turned into a 15-minute fix.”
The impact of this evolution in observability cannot be overstated:
- Faster Resolution: By automatically correlating application issues with infrastructure problems, teams can skip the manual investigation phase
- Improved Collaboration: Application and IT teams work from the same data and the same perspective
- Proactive Problem-Solving: When teams can quickly identify root cause, they can implement permanent solutions rather than temporary fixes
- Better Resource Utilization: Less time spent on investigation means more time for innovation and improvement
Enhanced End-User Experience: Faster problem resolution means less impact on end-users.
The Future of Advanced Synthetic Monitoring and Intelligent Observability
As organizations continue to adopt cloud-native architectures and complex microservices, the need for intelligent observability becomes even more critical. The future isn’t just about collecting data – it’s about automatically making sense of that data and bringing teams together to solve problems faster.
Modern observability platforms must evolve beyond simple monitoring and data collection. They need to:
- Handle complex workflows across multi-cloud and hybrid environments
- Provide automated correlation between synthetic checks and infrastructure events
- Leverage AI to identify patterns and potential issues before they impact users
- Break down silos between different IT and development teams
- Offer predictable pricing that aligns with value delivered.
As one IT operations leader puts it: “If you’re doing operations correctly with this level of correlation and automation, things are going to get cleaner and perform better over time. Both the application team and the IT team will be more productive down the road.”
The observability landscape is evolving rapidly, and organizations need to evolve with it. The future belongs to platforms that can bridge the gap between application and infrastructure teams, automate problem identification, and accelerate resolution times. It’s not just about monitoring anymore – it’s about intelligent observability that brings teams together and drives better outcomes for the business.
Want to learn more about how intelligent observability can transform your organization’s approach to monitoring and problem resolution? Contact Apica Engineering to see these capabilities in action.


