Intelligent observability
The most comprehensive and user-friendly platform in the industry.
Gain real-time insights into every layer of your infrastructure with automatic anomaly detection and root cause analysis.
Optimize performance, increase efficiency, and provide exceptional customer experiences.
problem
Struggling to handle data from complex, distributed systems?
Data volume and complexity
Overwhelmed by massive, intricate data from dispersed networks?
Toolchain fragmentation
Are disjointed tools hindering your productivity in complex systems?
Alert fatigue
Are you experiencing alert fatigue from constant, irrelevant notifications?
Security and privacy
How are you addressing data protection and user confidentiality concerns?
Cost and scalability
How do you manage expenses while ensuring system growth and scalability?
Organizational silos
How are you working to break barriers between isolated departmental functions?
BENEFITS
We can help. See how.

Better control
Enhance data control, reduce vendor lock-in.

Data storage
Cost savings

Compliance

Redundant

Security
FEATURES
Every control. At your fingertips.
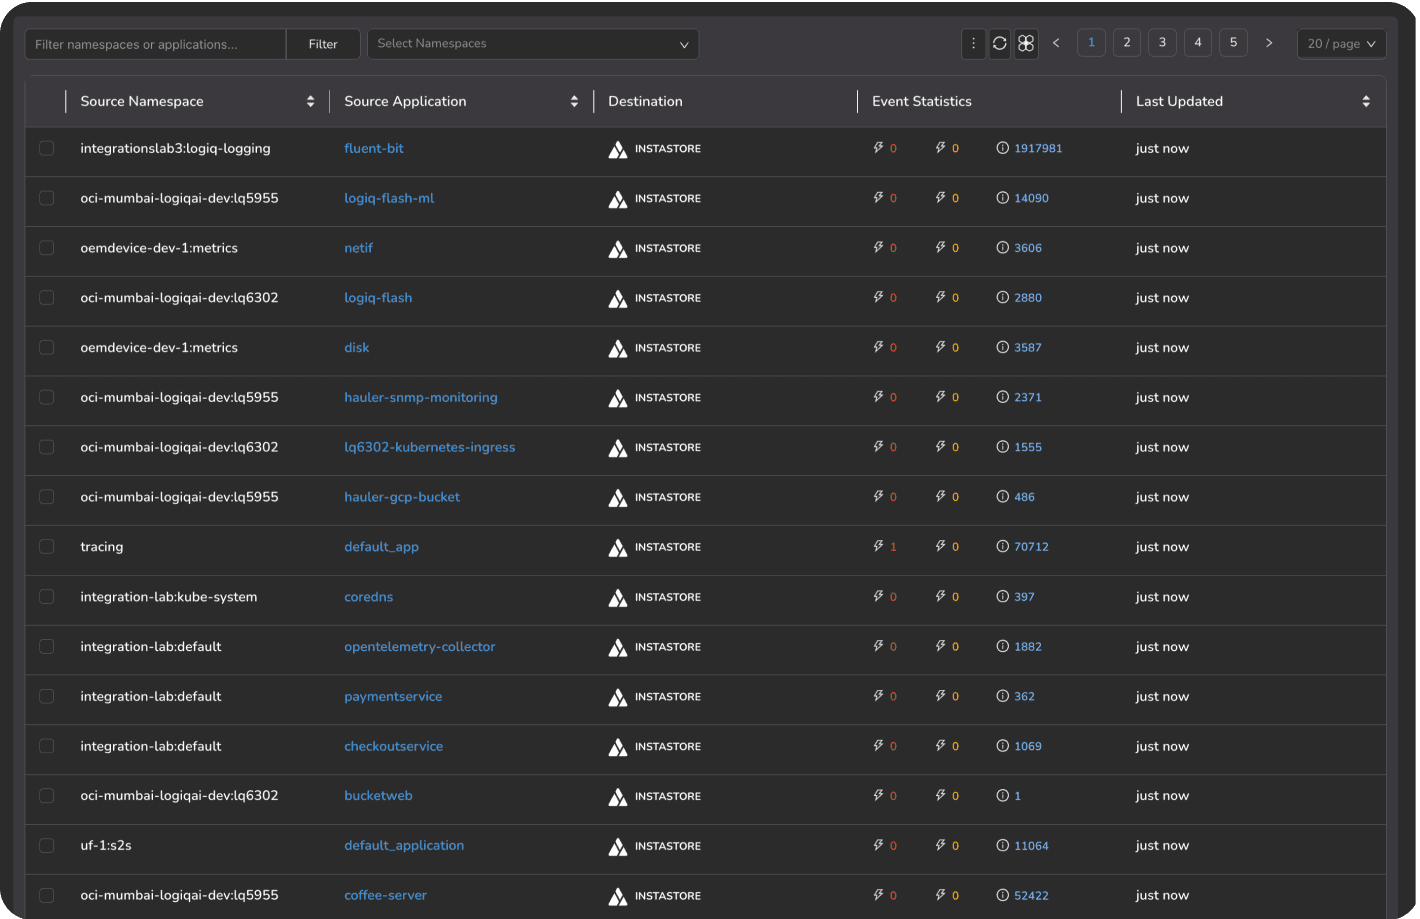
Intelligent observability
With Observe, collect and analyze MELT (metrics, events, logs, traces) data, giving you a comprehensive view of system health and performance and helping you identify and resolve issues quickly.
• Log management: End log data complexity
• Synthetic monitoring: Ensure uptime and performance of essential assets
• IronDB time series database (TSDB): Manage massive amounts of time-series data
• Infrastructure monitoring: Gain insights into the performance, availability, and health of your entire IT infrastructure.
• Distributed tracing: Profile and debug complex distributed systems; ingest, store, and analyze trace data across large, distributed environments.
- Seamless integration with Traces
- View all logs associated with a specific trace identifier
- Logs can be downloaded as CSV or JSON
- Deep integration with Metrics and Traces for a complete view of system behavior
- Deep integration with Logs and Traces for a complete view of system behavior
- Ability to navigate from a metric to a log and then to a trace
- Built-in support for OpenTelemetry and Jaeger protocols
- SpanStore built on InstaStore for optimized storage and retrieval of traced data
- Seamless integration with Logs for troubleshooting and analysis
- Deep integration with Metrics and Logs for a complete view of system behavior
ALIVE
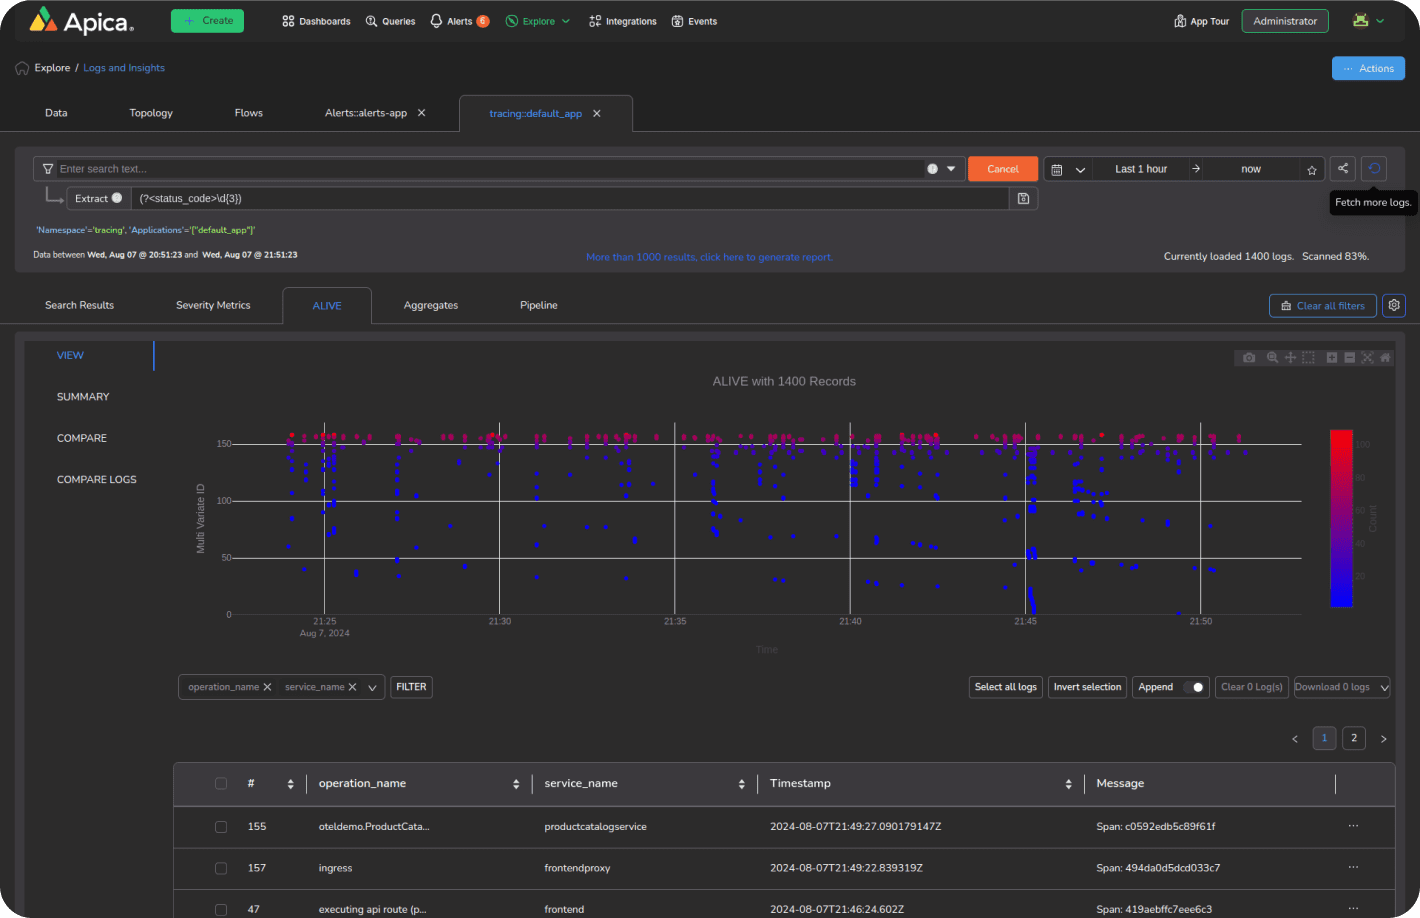
- Interactive visualization to pinpoint issues and patterns in applications
- Analyzes unstructured logs efficiently
- Create flows in the log event
- Visualization and insightful representation of unstructured log
Topology
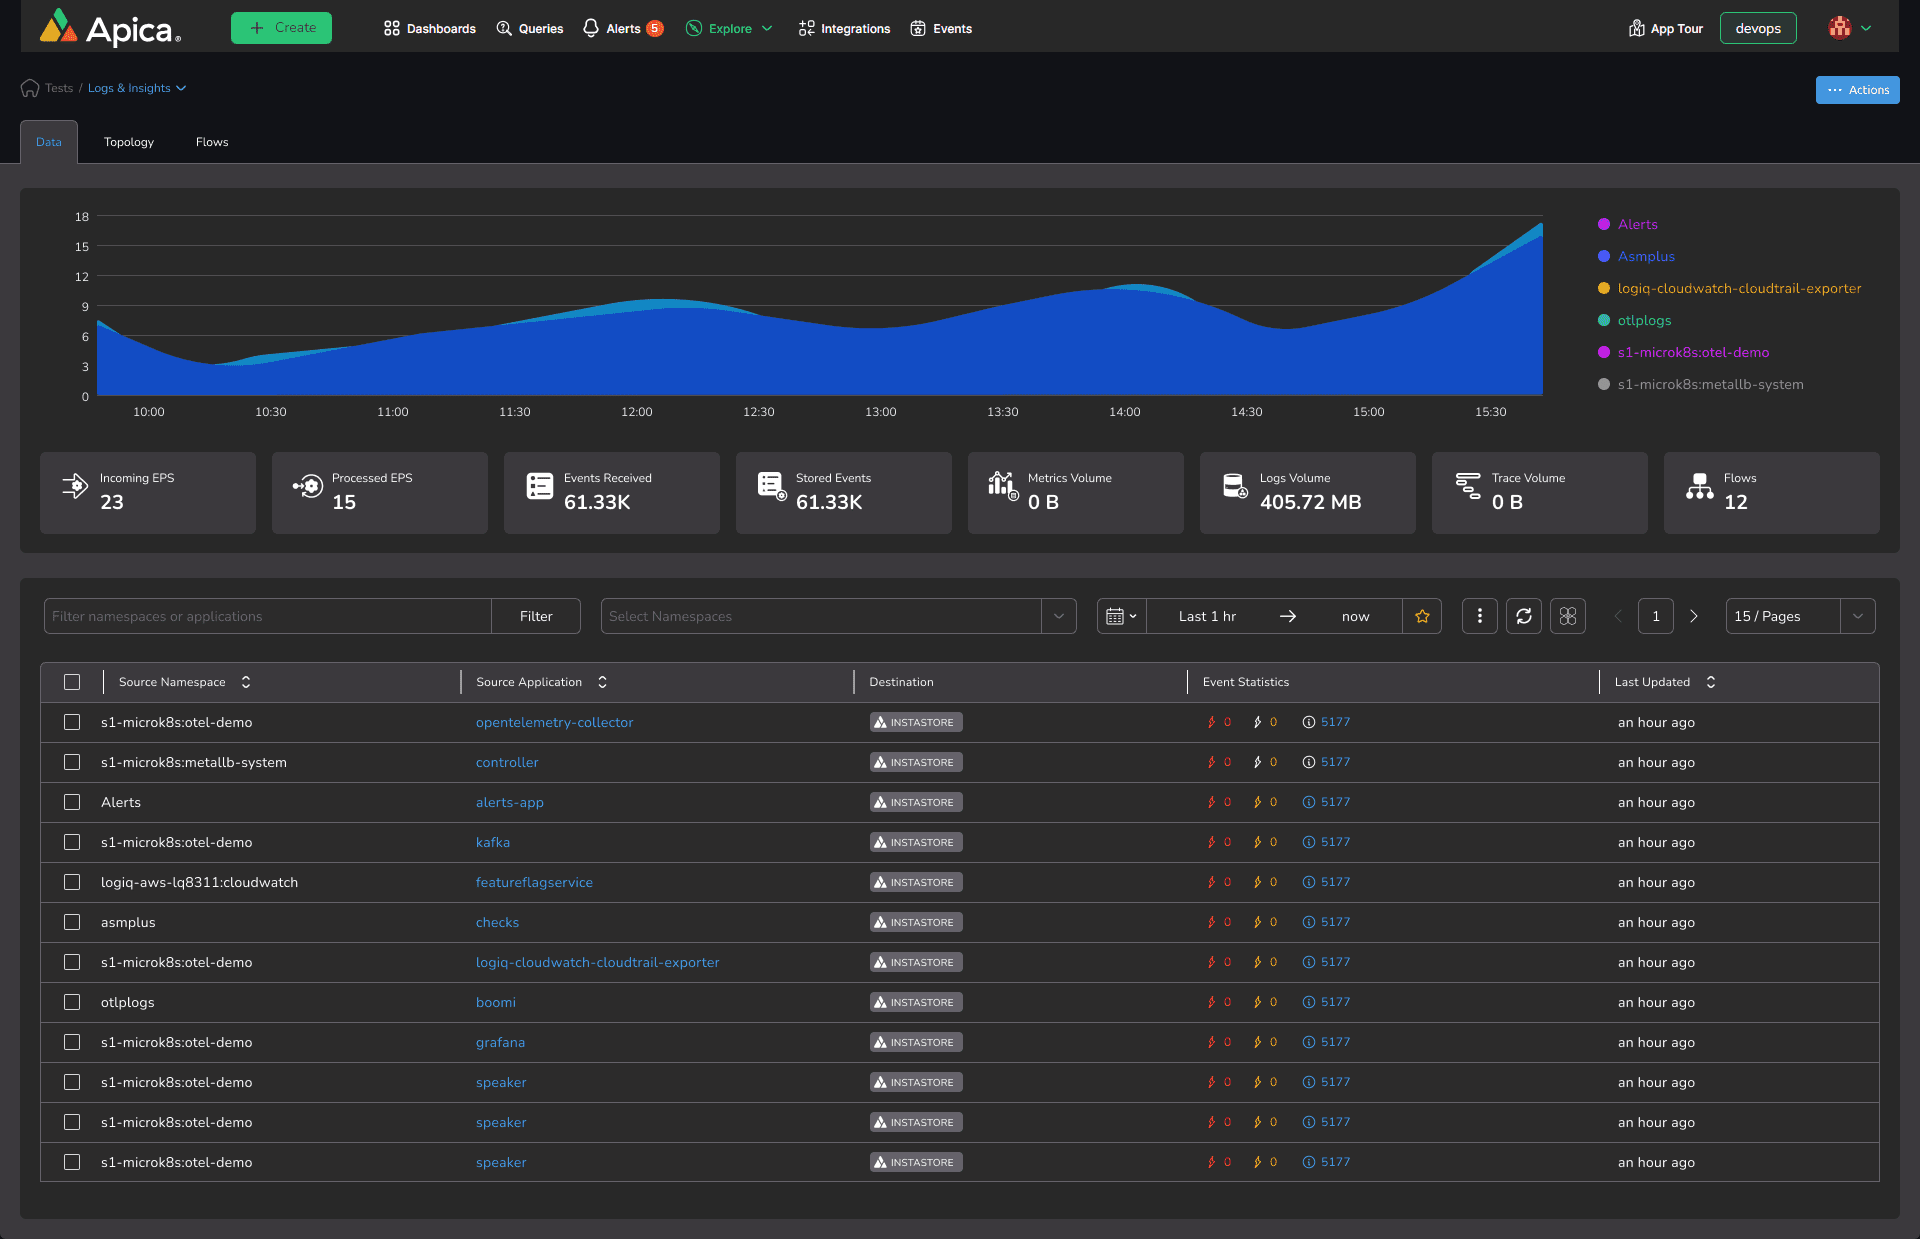
Apica offers a unique view called a topology view. In the topology view, you can distill information that may be split across hundreds of microservices into a topology hierarchy of how you manage the data and environments. This allows you to quickly look at where problems are happening in your infrastructure, rather than relying on search-based techniques to figure out where problems may be.
More Features
Anomaly detection and predictive analytics
Quickly detect and prevent issues before they escalate by utilizing advanced anomaly detection and predictive analytics capabilities.
User-friendly dashboard and interface
Easily monitor and analyze data from multiple sources across your infrastructure using our intuitive dashboard and user-friendly interface.
Integration with multiple data sources
Gain a comprehensive view of your infrastructure by seamlessly integrating and correlating data from multiple sources, including logs, metrics, traces, and packets.
Automated root cause analysis
Quickly identify and troubleshoot issues with automated root cause analysis, allowing you to minimize downtime and improve system performance.
Real-time data analytics and visualization
Real-time data analysis and visualization capabilities allows you to analyze data from across your infrastructure, providing instant insights into trends, patterns, and issues.
Role-based access control and security
Securely manage access to sensitive data and operations with our role-based access control and security features, providing peace of mind and compliance with industry regulations.
Extensible APIs for customization
Customize the platform to meet your specific needs and integrate with third-party tools using our extensible APIs, enabling you to automate workflows and streamline operations.
Multi-cloud and hybrid environment support
Get a unified view of your entire infrastructure regardless of where your systems and applications are deployed, providing full visibility and control over your operations.
INTEGRATE WITH ANY STACK





*Trademarks belong to the respective owners.

