OpenTelemetry also known as OTEL or OTel informally, is a community-driven open-source project. In other words, it is an observability framework that includes software and tools for producing and acquiring telemetry data from cloud-native platforms.
The merger of the OpenTracing and OpenCensus projects resulted in the birth of OpenTelemetry. Additionally, OpenTelemetry is a CNCF incubating project as of August 2021. According to the most recent CNCF dev statistics, OpenTelemetry is the second most active CNCF project next to Kubernetes.
Open Telemetry is a fast-growing framework for collecting and analyzing telemetry data in modern software systems. With the rise of cloud computing, microservices, and containers, traditional monitoring solutions are struggling to keep up with the growing complexity of modern applications. Open Telemetry provides a unified, vendor-neutral way to collect and aggregate telemetry data from different sources and make it available for analysis and visualization.
OpenTelemetry has various elements, with the most significant ones being:
APIs and SDKs designed for each programming language to create and send telemetry
A Collector component that can receive, handle, and export telemetry data
The OTLP protocol that facilitates the transmission of telemetry data.
Best Practices
Following are some best practices to help you get the most out of Open Telemetry:
- Start with a clear monitoring strategy
Before you start using Open Telemetry, it’s important to have a clear understanding of what you want to achieve with monitoring and observability. Are you looking to troubleshoot performance issues, track user behavior, or monitor your infrastructure? Once you have a clear monitoring strategy in place, you can select the right tools and components to support your goals.
- Use a common data model
Open Telemetry provides a common data model for telemetry data, making it easier to aggregate and analyze data from different sources. This includes standard fields for metadata, such as service name, operation name, and resource type. By using a common data model, you can simplify your data processing pipelines and avoid compatibility issues between different tools.
- Instrument your code properly
Instrumenting your code with Open Telemetry is the key to capturing valuable telemetry data. This involves adding trace information to your code, such as start and end times for requests and operations, as well as any additional metadata, such as user IDs and error codes. By instrumenting your code, you can gain a deeper understanding of how your applications are performing and where issues may arise.
- Consider using automatic instrumentation
Automatic instrumentation is a feature of Open Telemetry that can simplify the process of instrumenting your code. With automatic instrumentation, you can automatically collect telemetry data from common libraries and frameworks, such as HTTP servers, databases, and message brokers, without writing any custom code. This can save you time and effort, and reduce the risk of instrumentation errors.
- Choose the right collector and exporter
Open Telemetry provides a number of collectors and exporters that can be used to aggregate and export telemetry data to different systems, such as log analyzers, metrics stores, and tracing systems. When choosing a collector and exporter, consider factors such as compatibility, performance, scalability, and ease of use. You may also want to consider using a cloud-based solution, such as OpenTelemetry on the Google Cloud Platform, to simplify the deployment and management of your monitoring infrastructure.
By following these best practices, you can get the most out of Open Telemetry and improve your monitoring and observability capabilities. Whether you’re working with a single monolithic application or a complex microservices architecture, Open Telemetry provides a flexible, scalable solution for capturing and analyzing telemetry data.
OpenTelemetry: 101
Instrumenting applications and observability go hand-in-hand. Telemetry data, particularly logs, traces, and metrics are emitted from services upon execution. It gets hard to correlate traces, logs, and metrics from a multitude of applications and services. Not to mention that conventional methods can take hours, if not days, to determine the root cause of an incident. This is where Open telemetry comes to your rescue.
OpenTelemetry comprises multiple tools, including APIs, Collector, and SDKs. It gets complex to handle the telemetry data if you don’t have a roadmap to implement it properly. There are several guidelines to follow when operating with OpenTelemetry to ensure you have the best experience possible. Some of them are as follows:
-
Separate Initialization and Instrumentation
OpenTelemetry offers vendor-agnostic instrumentation through its API. This is a major advantage as it implies that each and every telemetry call that is made inside of the application comes from the OpenTelemetry API itself. Basically, there’s no dependency on any one vendor for instrumentation.
Additionally, OpenTelemetry allows you to put provider configuration at the top of your system which is generally at the entry point. What this does ultimately, is separate open telemetry instrumentation from the instrumentation calls.
Moreover, you get to choose the ideal tracing framework and there’s no need to change the instrumentation code as well. In a nutshell, you can switch providers easily by an environment variable if you decouple the initialization of a provider from instrumentation.
-
Get familiarized with the Configuration
To retrieve application traces, you have two methods for extracting traces from an application, namely “SimpleSpanProcessor” and “BatchSpanProcessor”. Epsagon defines them as, “The SimpleSpanProcessor submits a span whenever one is completed, whereas the BatchSpanProcessor buffers span until a flush event occurs. Flush events occur when a buffer is full or when a timeout is reached.”
-
Be wary when using Auto-Instrumentation by Default
You can use auto-tracing in multiple languages with OpenTelemetry, including Java, Python, Javascript, and PHP. Though auto instrumentation will drastically reduce constraints in your observability adoption, this also implies that it will add additional overhead too.
In the general scenario, there’s a direct connection between the database driver and the program. However, During Auto-instrumentation, there are additional functions involved. As a result, time and cost efficiency is reduced.
-
Utilize OpenTelemetry Unit Tests
Unit testing is an effective method to verify the metadata i.e, tags, metrics, counts, etc.
As not every language has proper documentation on the constructs and the usage, OpenTelemetry is the ideal place to look for usage data.
-
Follow the Source Code
OpenTelemetry is in its nascent stage currently. There isn’t highly much detailed documentation available still. For instance, there is no documentation for the BatchSpan Processor in the OpenTelemetry SDK. So the right way to go about it, at least for now, is through the source code itself.
-
Explore the community
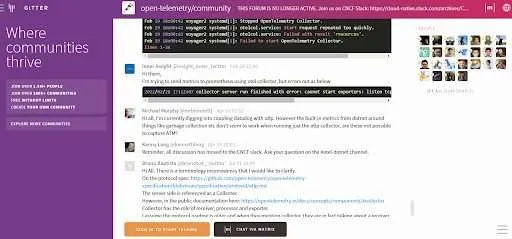
On Gitter, OpenTelemetry has a growing community, with an international channel available at open-telemetry/community. There are different channels for different languages, and there are numerous ways and opportunities to contribute, particularly to documentation and exporters.
The language-specific GitHub repo under the OpenTelemetry organization or the language-specific Gitter channel is the best place to look for information. However, Note that each language has varying degrees of support, documentation, and examples available.
Another valuable resource for getting more detailed information is the OpenTelemetry project’s official website.
OpenTelemetry and Apica
OpenTelemetry is more about the utilization of data rather than what data is available. Limited documentation may be available, but its capacities have kept up with the requirements. Now that Observability 2.0 has come to the forefront, OpenTelemetry has emerged as a one-stop solution for complex cloud application needs.
The focus of OpenTelemetry is on the data needed to completely understand, diagnose, and improve our applications. It is useful only when data can be scaled up for aggregation, analysis, and visualization.
The metrics could also be sent to a back-end to Apica. Once the OpenTelemetry collector or client has gathered telemetry data like metrics, logs, and traces from your application, AI may be used to analyze the performance and behavior of your apps.
With Apica’s InstaStore, you can arrange, index, and save all your trace data into an object store. Moreover, you get the ability to retrieve past traces infinitely. Apica is the ideal platform when it comes to distributed tracing implementation with tracing data compliance, long-term retention, and a hassle-free retrieval experience.
With Apica you can unlock business insights and improve efficiency with Apica’s OpenTelemetry integration. Furthermore, you can get Real-Time AI-Driven insights and take control of your operations.
With Apica’s OpenTelemetry integration, businesses can gain real-time AI-driven insights into their operations and take control of their data. OpenTelemetry offers unparalleled accuracy and scalability, allowing businesses to improve the efficiency of their operations and unlock new insights that were not previously available. With Apica’s powerful technology, businesses can quickly and easily integrate OpenTelemetry into their systems in order to unlock the power of artificial intelligence for their data.
In conclusion, Businesses can quickly and easily integrate OpenTelemetry into their systems in order to unlock the power of artificial intelligence for their data with Apica. The integration provides businesses with real-time insights into their operations, allowing them to make informed decisions and optimize processes. Apica’s AI-driven insights can help your enterprise to identify potential opportunities that you have missed, as well as uncover hidden patterns in your data.
OpenTelemetry and Apica’s analytics platform provides an easy way for your business to improve operations and unlock new insights that were previously unavailable. Therefore, you can not only gain a better understanding of your data but also use this insight to make more informed decisions by leveraging OpenTelemetry and Apica’s advanced analytics platform.
In a Glimpse:
- OpenTelemetry, or OTEL informally, is an open-source project and CNCF incubating project that provides a unified way to collect and aggregate telemetry data from different sources.
- To get the most out of Open Telemetry it’s important to have a clear monitoring strategy in place before starting as well as use its common data model for easier aggregation.
- Automatic instrumentation simplifies the process of instrumenting your code while selecting the right collector and exporter can help optimize performance.
- Separating initialization from instrumentation, getting familiarized with configuration settings, and using auto-instrumentation sparingly are some best practices when operating with OpenTelemetry.
- Unit testing helps verify metadata while exploring community resources like Gitter channels or official websites offering more detailed information on OpenTelemetery’s usage & capabilities; Apica’s InstaStore offers the ability to store tracing data infinitely for long-term retention & retrieval experience without any hassle

