APIs – by now, we’re all familiar with the term. Every service or software we use or build today either uses or is an API. If APIs are a central pillar in your building and delivery of software and services, you’ll know that the success of your software or services depends on the integrity, availability, and performance of your APIs. Traditional API monitoring sure does help you stay on top of uptime, security, and performance. Still, it is limited to being a black box form of monitoring – you’re only testing API behavior that you’d only see externally. You’d still have to guess what’s causing issues with your APIs as you’re only testing, measuring, and monitoring them against metrics you already know – like request rates, error rates, or status codes.
Traditional API monitoring lets you monitor system health and performance but can’t help you identify and troubleshoot what’s causing issues. And the more your system’s dependency on APIs increases, the more you’ll find yourself modifying the metrics you track, guessing which parts of your API may cause problems, and not moving any closer to root causes.
At this stage, establishing a proper API Observability strategy starts making more sense. API Observability is all about making your APIs more observable. Instead of relying on predetermined metrics and monitoring and waiting for failure, API Observability lets you dive into the unknown unknowns of your APIs by observing how they work internally. With API Observability, you can analyze data exposed by the internals of your API system and identify patterns and behavior that help you prevent threats, identify and troubleshoot issues, and understand API usage.
What’s the easiest way to make your APIs observable, you ask? Use Apica.
Apica is a complete observability platform for monitoring, log aggregation, and analytics with an infinite storage scale. The Apica platform includes:
- A User Interface (UI)
- A command-line toolkit
- A monitoring stack for time-series metrics, and
- A log analytics stack for log data.
But how does Apica help with API Observability? Here’s how.
Support for popular API Gateways
Apica can aggregate logs from popular API gateways like Istio, NGINX, HAProxy, Apache, and more. Integrating Apica with your API gateways gives you complete visibility into API usage in your environment.
Automated extraction for API attributes
Apica includes full support for GROK expressions. You can write powerful rules in GROK to extract API attributes from standard API log formats such as Common Log and Apache. With GROK expressions, you can comb through API log traces to extract information like API methods, response times, URLs, sender information, payload length, request rates, and error rates.
Visualizing API data with LOG2Metrics
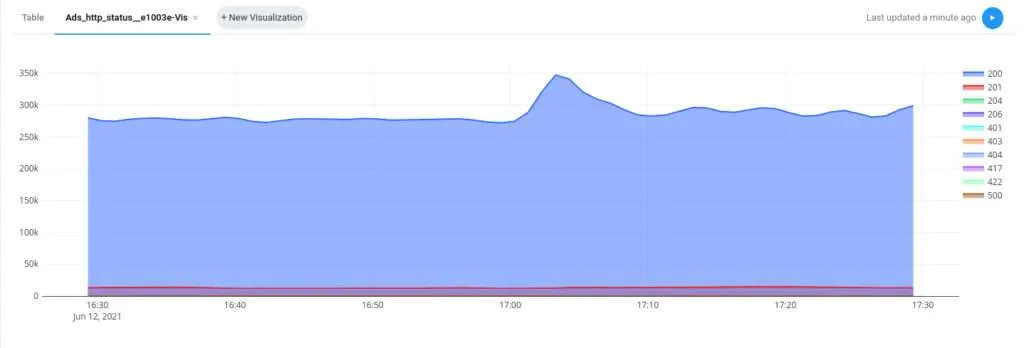
With LOG2Metrics, you can transform ingested API log traces into multiple time-series visualizations using powerful attribute or pattern-based group-by expressions. For example, you can easily query for GET requests made to api /v1/resource/<id> and generate time-series visualizations by ID.
Performance Visualization & Alerting
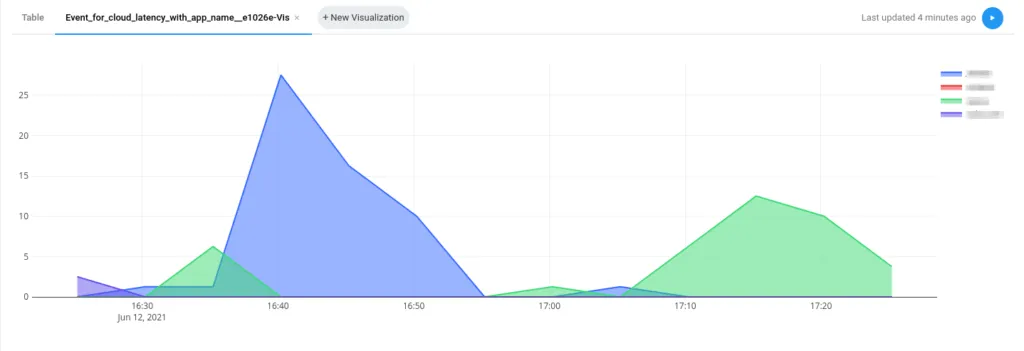
Using Apica, you can plot API response times extracted from your API logs and gain total visibility over how your APIs perform. Moreover, Apica’s alerting capabilities let you build alerts that notify you instantly when an API begins to underperform. You can also eliminate false positives by creating alerting rules that only trigger after being validated against frequency thresholds in intervals that you can customize. For example, you could choose to get alerted if an event occurs more than 10 times in a 5-minute interval.
Historical Reporting
You can generate insightful and periodical ad hoc reports on historical API data scheduled with a built-in CRON job. For example, with a few clicks, you can create a report that shows you all client IP addresses that generated 4xx errors, grouped by HTTP status codes and IP addresses.
Extract Business Intelligence from APIs
Empower your Support and Services organizations by using Apica to extract insightful business-level metrics around API usage, avenues to harden security, and product analytics from log data. For example, in case your software or service offers public-facing APIs and you’d like to know how your partner integrations are faring, you can monitor the health of your API usage by partners and notify your support and services team when you start seeing increased error rates.
Closing Thoughts
An API Observability platform is more than an accessory for your overall API strategy. The right approach to API Observability can provide you with invaluable insights about API usage while identifying security loopholes and maintaining the overall health, performance, and availability of your APIs. Now’s the time to adopt API Observability to optimize the way your APIs are shipped and how they perform by establishing visibility into the inner workings of your API system. To get started with API Observability, install the free-forever LOGIG PaaS Community Edition and integrate it with your API server.

