TRACES
Trace Smarter.
Optimize Swiftly.
Collaborate Seamlessly.
Troubleshoot and analyze performance issues with Apica’s OpenTelemetry and Jaeger-compatible distributed tracing implementation.
problem
Dealing with instrumentation, collecting, and tracing issues?

Complexity

Overhead

Scalability
Trace data volumes generated in a large and distributed system can be overwhelming and difficult to scale.

Data privacy

Data Analysis
Analyzing large amounts of trace data can be challenging, requiring specialized tools and expertise.

Data Correlation
Correlating trace data across services can be difficult when dealing with different data formats and structures.
BENEFITS
Apica Can Help.
See How.
Correlate and analyze data from different parts of your system.
User-friendly interface and easy adoption.
FEATURES
Controls In Your Hands
Compatible with OpenTelemetry and Jaeger
Apica’s distributed tracing implementation has built-in support for OpenTelemetry and Jaeger protocols. Use either a Jaeger agent or an OpenTelemetry collector to stream logs, metrics, and traces at scale. Our SpanStore is built on InstaStore, Apica’s indexed object storage built for observability.
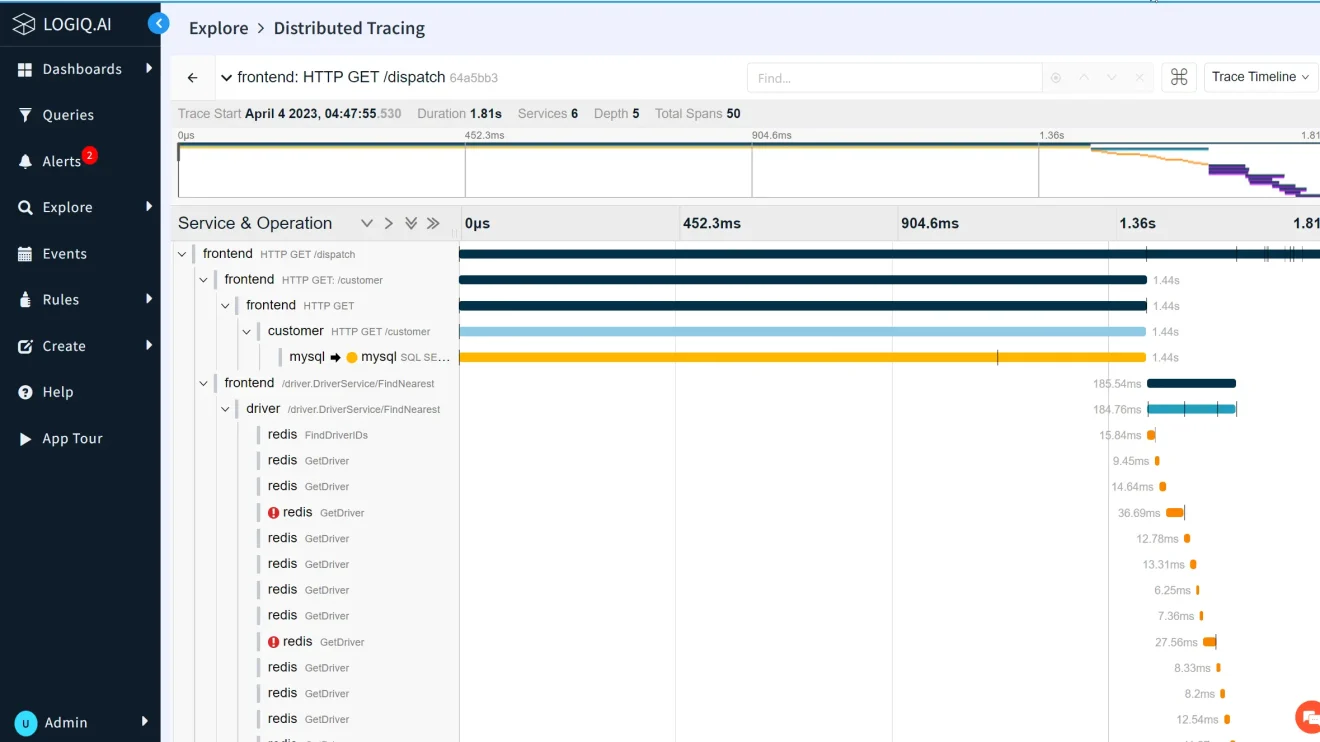
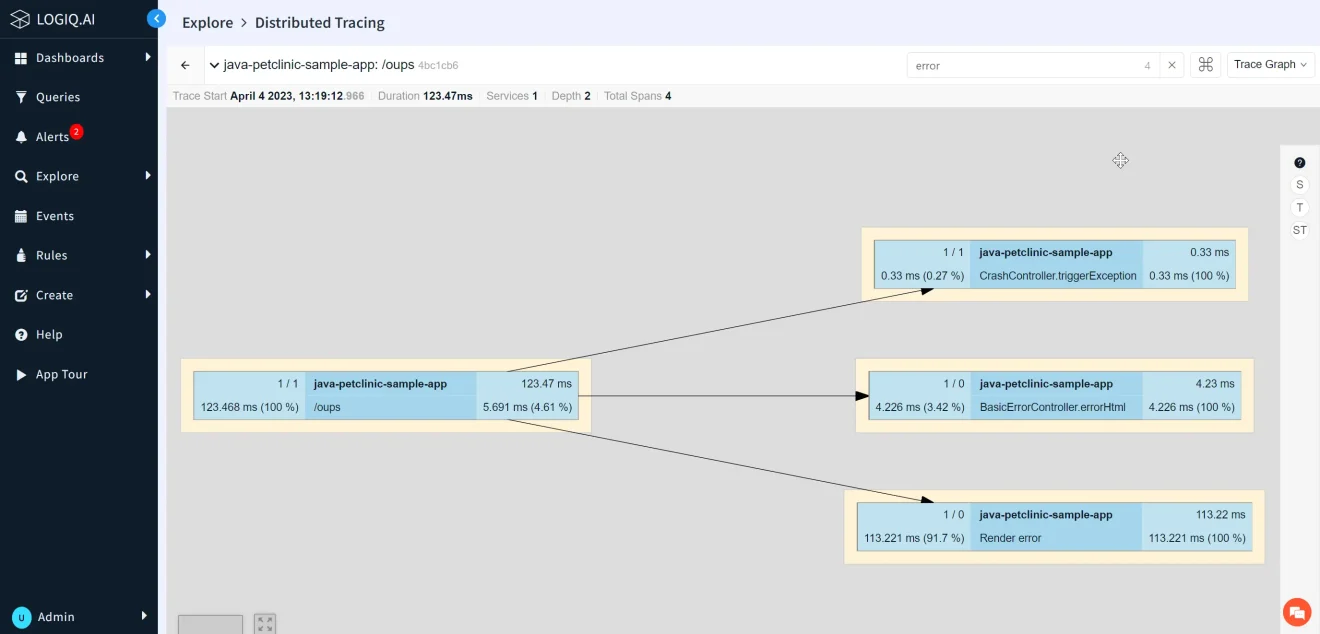
Pinpoint failures across your distributed applications
Switch from Traces to Logs
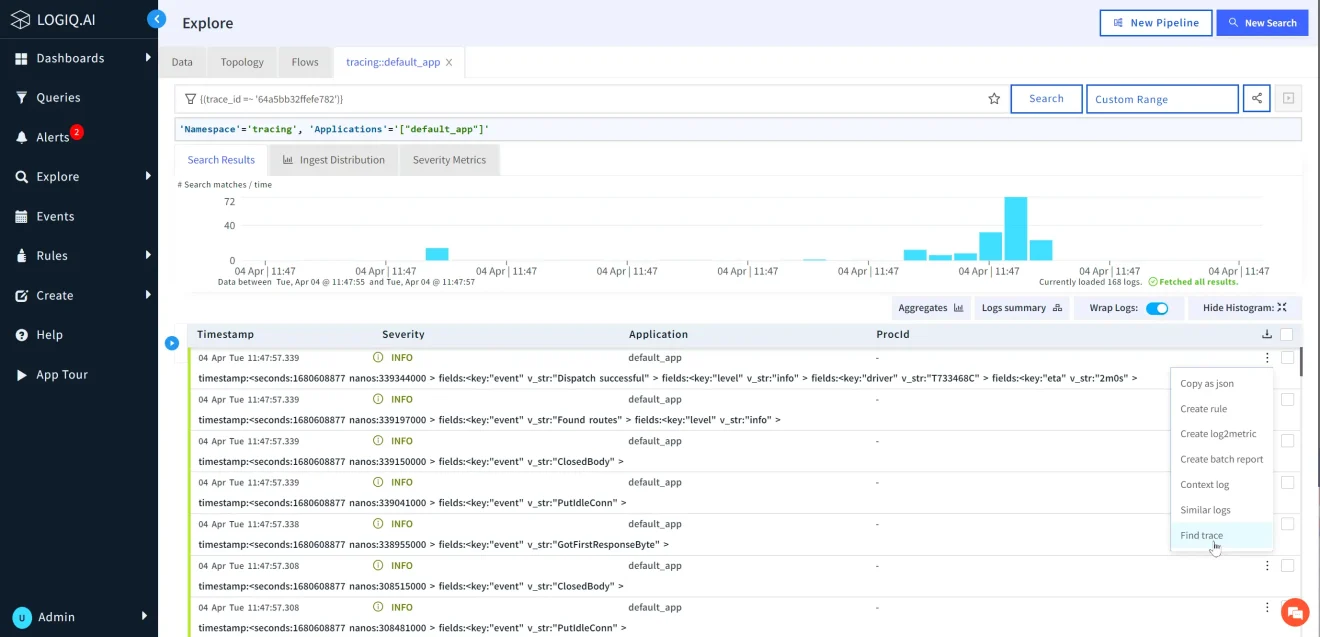
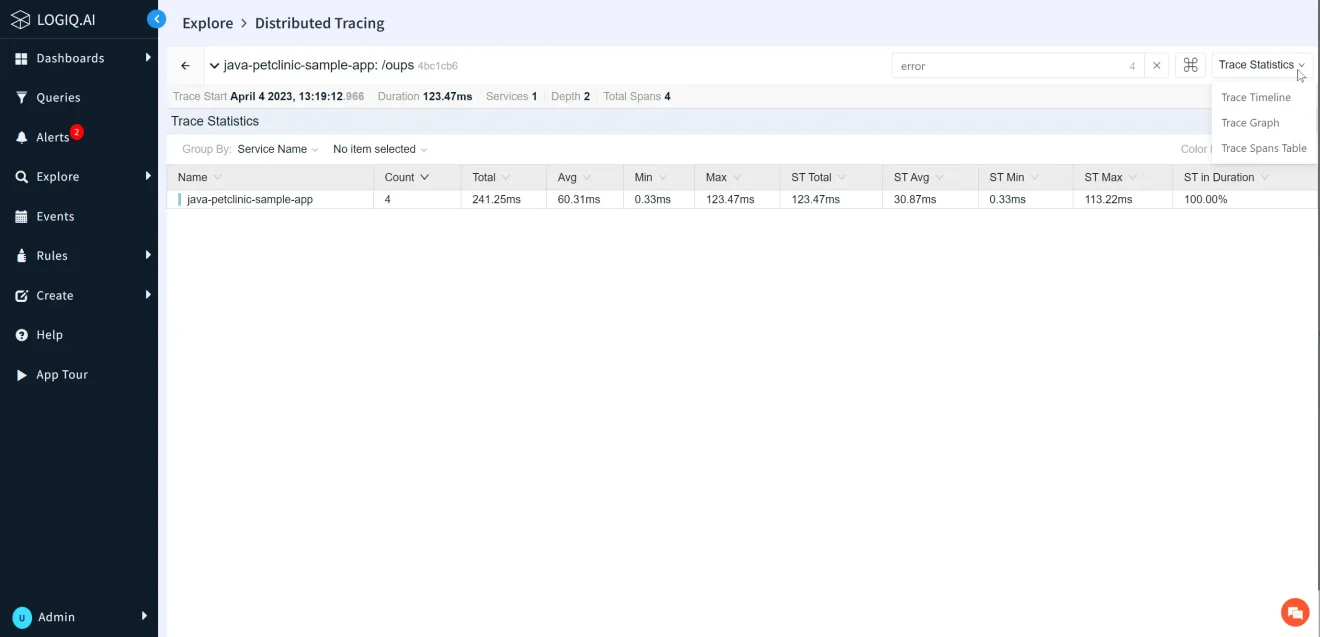
Apica integrates Logs and Traces into a seamless experience. Switch over from Traces and go to Logs to view all logs for a given trace identifier. Even download them as CSV and JSON. Troubleshooting and integrating with your workflows could not get easier than this.
...and back, and more!
Our deep integration between Logs, Metrics, and Traces means you can navigate to a trace from a log you search. Not only that, go from a Metric to a Log to a Trace.
Get our Comprehensive Logs Data Sheet right into your Inbox
HOW IT WORKS
Set up OpenTelemetry and Jaeger:
- Install OpenTelemetry collectors, Jaeger agents.
- Configure instrumentation libraries for trace data.
Integrate Apica with OpenTelemetry and Jaeger:
- Configure Apica for trace/log ingestion.
- Ensure Apica accesses object storage.
Instrument your services:
- Add instrumentation code, generate trace data.
- Send data to collectors, agents.
Collect and analyze data:
- Monitor data from various sources.
- Leverage Apica's processing, storage.
Use Apica's built-in UI for visualization:
- Visualize spans, traces, logs in UI.
- Gain insights into request flow.
Identify bottlenecks and issues:
- Analyze data, identify performance issues.
- Debug by examining request flow.
Optimize your systems:
- Debug by examining request flow..
- Implement changes, monitor results.
Maintain and update your tracing setup:
- Keep collectors, agents, libraries updated.
- Review tracing data, ensure system health.
INTEGRATE WITH

*Trademarks belong to the respective owners.

